Introduction
Would you like to increase revenue without having to get more customers? Most field service business owners would say, “Heck yeah! Sign me up!”
Making more money from current customers is just as important as finding new ones. But we don’t want to price gouge. Instead, we want to cross sell and find our attach rate.
The attach rate is how often extra products or services are sold along with the main purchase. It’s a powerful way to boost sales and profits across many industries.
Big companies do this all the time—like selling phone cases with phones or offering investment help with new bank accounts. But many businesses still don’t use this strategy enough.
This guide breaks down what attach rate means, how to measure it, and how to improve it, so you can make the most of every sale.
What Is Attach Rate? Definition and Basics
The attach rate measures the frequency or percentage at which secondary products or services are sold in conjunction with a primary product or service. It quantifies a company's effectiveness at cross-selling related items or expanding the initial purchase value.
Core Definition
In its simplest form, the attach rate is calculated as
Attach Rate = Number of Attached Products Sold ÷ Number of Primary Products Sold
For example, if a retailer sells 100 laptops (primary product) and 70 laptop cases (attached product) in a month, the attach rate for laptop cases would be 70%.
However, the concept extends beyond this basic calculation, as many businesses track multiple attached products or measure the metric in different ways depending on their industry and specific needs.
Terminology Variations
Different industries and organizations may use alternative terms for the same concept
Types of Attach Rate Measurements
Organizations measure attach rates in several ways.
- Unit-Based Attach Rate: The traditional calculation focusing on the number of attached items per primary product (e.g., 0.7 laptop cases per laptop sold).
- Revenue-Based Attach Rate: Measures the additional revenue generated from attached products as a percentage of primary product revenue, providing insight into financial impact rather than just unit volume.
- Customer-Based Attach Rate: Tracks the percentage of customers who purchase at least one additional item, regardless of how many primary items they buy.
- Category Attach Rate: Measures attachments across an entire product category rather than specific SKUs, providing a broader view of cross-selling success.
Industry Examples
Attach rates vary widely across industries and product types
Industries Where Attach Rate Is Critical
While important across most businesses, certain industries find attach rate particularly crucial to their revenue model and profitability.
Retail Industry
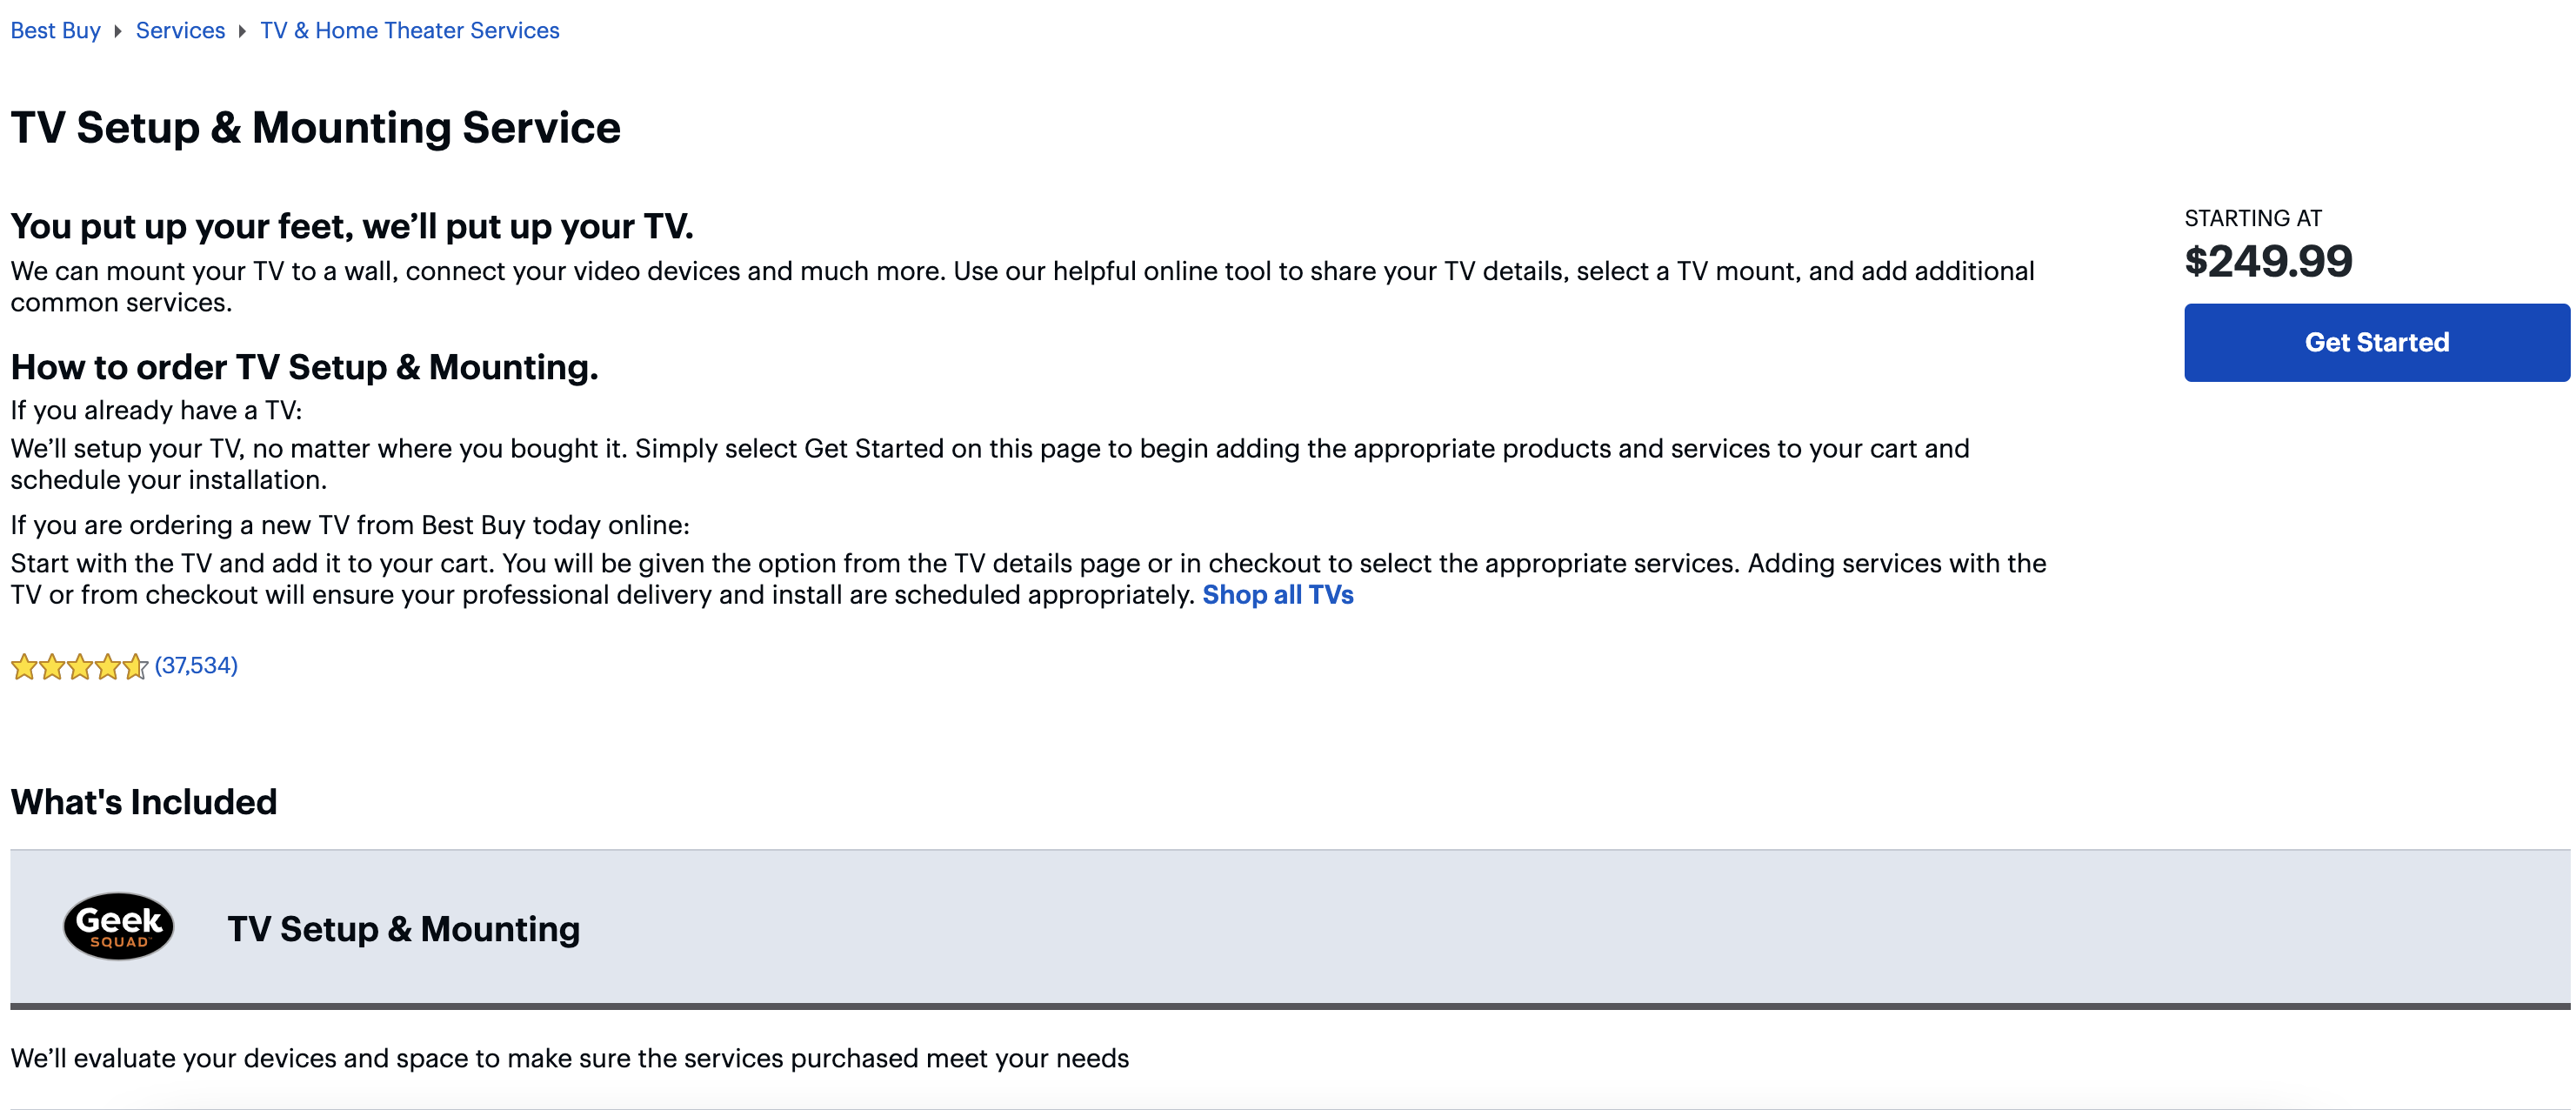
In retail, attach rates drive significant incremental revenue and margin enhancement
Retailers like Best Buy have built business models where attach rate optimization is central to profitability, with services and accessories compensating for thin margins on primary products. Just check out this simple TV set up and mounting offer they have.
Technology and Software
The technology sector often relies heavily on the attach model
Microsoft's Xbox division, for example, may sell consoles at minimal profit but generates substantial revenue through game sales, subscriptions, and digital content—all forms of attachment to the primary hardware purchase.
Financial Services
Banks and financial institutions track attach rates for
Wells Fargo, before its cross-selling scandals, famously focused on its "Eight is Great" strategy, aiming for eight financial products per household—essentially an attach rate target.
Telecommunications
Telecom providers track
AT&T, Verizon, and other providers measure success partly through their ability to attach multiple services to each household.
The Attach Rate Formula and Calculation
Understanding the various ways to calculate attach rate helps ensure you're measuring what matters most for your business.
Basic Calculation Method
The standard formula for unit-based attach rate
Attach Rate (%) = (Number of Attached Items Sold ÷ Number of Primary Items Sold) × 100
Example: A computer store sells 200 laptops and 120 laptop bags in a month.
Attach Rate = (120 ÷ 200) × 100 = 60%
This means 60% of laptop purchases included a laptop bag.
Revenue-Based Calculation
To understand financial impact
Revenue-Based Attach Rate (%) = (Revenue from Attached Items ÷ Revenue from Primary Items) × 100
Example: If those 200 laptops generated $200,000 in revenue, and the 120 bags generated $12,000:
Revenue-Based Attach Rate = ($12,000 ÷ $200,000) × 100 = 6%
This lower percentage reflects the price difference between primary and attached products.
Multi-Item Attachment Calculation
For businesses where multiple items may attach to a single primary purchase
Average Attachment Rate = Total Number of Attached Items Sold ÷ Number of Primary Items Sold
Example: If 200 laptop purchasers also bought 120 bags, 80 mice, and 40 extended warranties:
Average Attachment Rate = (120 + 80 + 40) ÷ 200 = 1.2
This means each laptop purchase resulted in an average of 1.2 additional items.
Weighted Attach Rate Calculation
When some attachments are more strategically important than others
Weighted Attach Rate = ∑(Weight × Specific Attach Rate) ÷ ∑Weights
Example: If a company assigns different weights to various attachments
Weighted Attach Rate = [(1 × 60) + (3 × 20) + (2 × 15)] ÷ (1 + 3 + 2) = 25.8%
Attach Rate vs. Other Sales Metrics
Understanding how attach rate relates to and differs from other key sales metrics helps integrate it effectively into your overall performance measurement system.
Attach Rate vs. Conversion Rate
While often confused, these metrics measure different aspects of sales performance
Conversion Rate: The percentage of potential customers who complete a purchase (visitors to buyers).
Attach Rate: The percentage of buyers who add supplementary items to their primary purchase.
Conversion rate focuses on acquiring customers, while attach rate focuses on maximizing each customer's purchase value.
Attach Rate vs. Average Order Value (AOV)
These metrics are complementary but distinct
AOV: The average monetary value of each order.
Attach Rate: The frequency of additional items being added to orders.
A high attach rate typically drives a higher AOV, but AOV can also increase through other means (e.g., selling premium primary products).
Attach Rate vs. Cross-Sell Rate
Though sometimes used interchangeably, these metrics can have subtle differences
Attach Rate: Typically measures complementary items sold at the same time as the primary purchase.
Cross-Sell Rate: Often refers to additional products sold to existing customers over time, possibly in separate transactions.
In practice, many organizations use these terms with some overlap.
Attach Rate vs.Customer Lifetime Value (CLV)
Attach rate serves as a leading indicator for CLV in many businesses
Setting Attach Rate Goals and Benchmarks
Establishing appropriate targets requires understanding industry norms and your specific business context.
Industry Benchmark Ranges
Typical attach rate benchmarks vary significantly by industry
Establishing Internal Baselines
Before setting goals, establish your current performance
1. Historical Analysis: Review 12+ months of sales data to establish your baseline
2. Segment Analysis: Break down attach rates by product categories, customer segments, and sales channels
3. Variability Assessment: Understand performance ranges across sales teams, locations, or time periods
4. Opportunity Sizing: Quantify the revenue potential of improvement
Segmented Goal Setting
Rather than setting a single company-wide attach rate target, consider
Realistic vs. Stretch Goals
Effective goal setting typically involves
Strategies to Improve Attach Rate
If you’re systematic about improving your attach rate, you’ll get better results than ad hoc efforts.
Sales Process Optimization
Refine your sales approach to naturally incorporate attachments
Product Bundling Strategies
We have a whole article on how bundling products improves profit margins. Some common approaches include
Pricing Psychology
Price presentation definitely impacts attach rates
Technology-Enabled Recommendations
Leverage systems to improve attach rates
Technology Solutions for Attach Rate Optimization
Modern businesses leverage various technologies to systematically improve attach rates.
CRM and Sales Force Automation
Configure your customer relationship management system to
E-commerce Platforms
Online stores can implement
Point of Sale Systems
Retail POS systems should
Mobile Clienteling Tools
Equip sales teams with mobile tools that
Examples: Successful Attach Rate Programs
Here’s an example of how this could play out in the real-world. These examples are strictly for demonstration purposes to show attach rate optimization.
Technology Retailer
Company: Major consumer electronics chain
Challenge: Declining margins on core products due to online competition
Approach
Results
Financial Services
Company: Regional bank with 80+ branches
Challenge: Low product penetration per household (1.6 products/customer)
Approach
Results
Balancing Attach Rate and Customer Experience
While improving attach rates boosts revenue, maintaining customer satisfaction requires even more intentionality.
Value-Focused Approach
The most sustainable attach rate programs focus on customer value
If you're too pushy or recommend unhelpful attachments, you may inadvertently increase rather than decrease your refund rate.
Customer Journey Integration
Identify the natural points where attachments make sense
Measuring the Customer Impact
Monitor how attach rate initiatives affect customer satisfaction
Conclusion
The attach rate stands as one of the most powerful yet underoptimized metrics in sales. By measuring, analyzing, and improving your organization's ability to sell complementary products and services, you can significantly enhance profitability without the high costs of new customer acquisition.
The most successful attach rate programs combine thoughtful strategy, proper staff training, supportive technology, and customer-centric approaches. When implemented correctly, these programs create win-win outcomes—customers receive more complete solutions to their needs, while businesses increase revenue and strengthen customer relationships.
Attach rate optimization works for any industry. It’s one of the highest ROI activities you can make in your sales process. Higher attach rate = higher revenue, plain and simple.
FAQ Section
What is a good attach rate percentage?
There's no universal "good" attach rate as ideal percentages vary significantly by industry, product type, and business model. Technology hardware often sees 40-70% attach rates for accessories, while financial services typically target 30-50% for related products. Rather than focusing on general benchmarks, establish your current baseline, research industry-specific standards, and set progressive improvement goals. Most organizations benefit from incremental improvement targets (e.g., improving from 25% to 30%) rather than arbitrary targets disconnected from their specific context.
How often should attach rate be measured?
For most businesses, monthly measurement provides a good balance between timely insights and statistical reliability. However, the optimal frequency depends on your sales volume and business rhythms. High-volume retailers might benefit from weekly or even daily tracking, while businesses with longer sales cycles might use quarterly analysis. The key is maintaining consistency in measurement methodology and timing. Many organizations use a tiered approach: daily/weekly monitoring for operational management, monthly analysis for tactical adjustments, and quarterly reviews for strategic planning.
Can attach rate be too high?
Yes, an exceptionally high attach rate can sometimes indicate problems rather than success. Potential issues include: 1) Customers being pressured into purchasing unwanted items, potentially leading to returns, complaints, and damaged reputation; 2) Primary products priced artificially low, forcing attachments to achieve profitability; 3) Incomplete primary products that require attachments to function properly; or 4) Sales staff neglecting customer needs to push attachments. The optimal attach rate balances revenue maximization with customer satisfaction and long-term relationship building.
How do seasonal factors affect attach rate?
Seasonal variations can significantly impact attach rates through several mechanisms: 1) Gift-giving seasons often reduce attach rates as purchasers buy primary products for others without accessories; 2) Budget cycles (especially in B2B) may increase attach rates at year-end as departments utilize remaining funds; 3) Holiday staffing with temporary employees may reduce attach rates due to less training; and 4) Promotional periods can either enhance or depress attach rates depending on whether attachments are included in offers. For accurate performance assessment, compare attach rates to the same period in previous years rather than to different seasons
Stop Lighting Money on Fire With Failed Ads